Code Documentation: Plots
mastml.plots Module
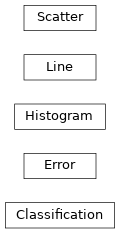
This module contains classes used for generating different types of analysis plots
- Scatter:
This class contains a variety of scatter plot types, e.g. parity (predicted vs. true) plots
- Error:
This class contains plotting methods used to better quantify the model errors and uncertainty quantification.
- Histogram:
This class contains methods for constructing histograms of data distributions and visualization of model residuals.
- Line:
This class contains methods for making line plots, e.g. for constructing learning curves of model performance vs. amount of data or number of features.
Functions
|
Return the ceiling of x as an Integral. |
Method to check the dimensions of supplied data. |
|
|
Build a text report showing the main classification metrics. |
|
Calculate the width and height for a figure with a specified aspect ratio. |
|
Method to obtain a sensible divisor based on range of two values |
|
Return the logarithm of x to the given base. |
|
|
|
Method to make the x and y ticks for each axis the same. |
|
Method to make matplotlib figure and axes objects. |
|
Method to make square shaped matplotlib figure and axes objects. |
|
Helper function to make collections of different types of plots after a single or multiple data splits are evaluated. |
|
Draw a box to mark the location of an area represented by an inset axes. |
|
Method to return mean of a list or equivalent array with NaN values |
|
Method to create a range of values, including the specified start and end points, with nicely spaced intervals |
|
Method to return standard deviation of a list or equivalent array with NaN values |
|
Function to plot the average score of each feature against their occurrence in all of the splits |
|
DEPRECATED: Function plot_confusion_matrix is deprecated in 1.0 and will be removed in 1.2. |
|
Function to plot the occurrence of each feature in all of the splits |
|
Method that prints stats onto the plot. |
|
\(R^2\) (coefficient of determination) regression score function. |
|
Method to recursively find the max value of an array of iterables. |
Method to recursively return max and min of values or iterables in array |
|
|
Method to recursively find the min value of an array of iterables. |
|
|
|
Method to return a rounded down number |
|
Method to return a rounded up number |
|
Method to obtain number of decimal places to report on plots |
|
Method that converts a metric object into a string for displaying on a plot |
|
Method used to trim a set of arrays to make all arrays the same shape |
|
Create an anchored inset axes by scaling a parent axes. |
Classes
Classification plots |
|
|
Class to make plots related to model error assessment and uncertainty quantification |
|
Collection of functions to conduct error analysis on certain types of models (uncertainty quantification), and prepare residual and model error data for plotting, as well as recalibrate model errors with various methods |
|
The top level container for all the plot elements. |
|
alias of |
|
A class for storing and manipulating font properties. |
Class to generate histogram plots, such as histograms of residual values |
|
|
|
|
Class containing methods for constructing line plots |
|
Ordinary least squares Linear Regression. |
|
Class containing access to a wide range of metrics from scikit-learn and a number of MAST-ML custom-written metrics |
|
Exception class to raise if estimator is used before fitting. |
|
Class to generate scatter plots, such as parity plots showing true vs. |
|
Representation of a kernel-density estimate using Gaussian kernels. |
Class Inheritance Diagram
