Feature selection and learning curves
As mentioned above, one problem with our current model is over-fitting. To further understand and minimize the effect of over-fitting, it is often necessary to construct learning curves and perform feature selection to obtain a reduced feature set which most accurately describes your data. To do this, we are going to add two additional sections to our input file.
The first section is related to feature selection. Here, we will use the SequentialFeatureSelector algorithm, which performs forward selection of features. We will select a total of 20 features, and use a KernelRidge model to evaluate the selected features. Here, we ahve denoted our estimator as “KernelRidge_select”. The models used in feature selection and learning curves are removed from the model queue, because in general one may want to use a different model for this step of the analysis than what will ultimately be used for fitting. Therefore, we need to also amend our models list to have this new KernelRidge_select model, as shown below.
Example:
[FeatureSelection]
    [[SequentialFeatureSelector]]
        estimator = KernelRidge_select
        k_features = 20

[Models]
    [[KernelRidge]]
        kernel = rbf
        alpha = 1
        gamma = 1
    [[KernelRidge_select]]
        kernel = rbf
        alpha = 1
        gamma = 1
The second section we will add is to plot learning curves. There are two types of learning curves MAST-ML can make: a data learning curve and feature learning curve. The former is a plot of the metric of interest versus the amount of training data used in the fits. The latter is a plot of the metric of interest versus the number of features comprising the X feature matrix. In the example LearningCurve input file section shown below, we are going to use a KernelRidge model, a random k-fold cross-validation and the root_mean_square_error to evaluate our learning curves. We will also use a maximum of 20 features, and use the SelectKBest algorithm to assess the choice of features.
Example:
[LearningCurve]
    estimator = KernelRidge_learn
    cv = RepeatedKFold_learn
    scoring = root_mean_squared_error
    n_features_to_select = 20
    selector_name = SelectKBest
As with the above example of FeatureSelection, we need to add the KernelRidge_learn and RepeatedKFold_learn entries to the Models and DataSplits sections of our input file, respectively. At this point in the tutorial, the complete input file should look like this:
Example:
[GeneralSetup]
    input_features = Auto
    input_target = Reduced barrier (eV)
    randomizer = False
    metrics = Auto
    input_other = Host element, Solute element, predict_Pt

[DataCleaning]
    cleaning_method = imputation
    imputation_strategy = mean

[FeatureGeneration]
    [[Magpie]]
        composition_feature = Solute element

[FeatureNormalization]
    [[StandardScaler]]

[FeatureSelection]
    [[SequentialFeatureSelector]]
        estimator = KernelRidge_select
        k_features = 20

[LearningCurve]
    estimator = KernelRidge_learn
    cv = RepeatedKFold_learn
    scoring = root_mean_squared_error
    n_features_to_select = 20
    selector_name = SelectKBest

[Models]
    [[KernelRidge]]
        kernel = rbf
        alpha = 1
        gamma = 1
    [[KernelRidge_select]]
        kernel = rbf
        alpha = 1
        gamma = 1
    [[KernelRidge_learn]]
        kernel = rbf
        alpha = 1
        gamma = 1

[DataSplits]
    [[NoSplit]]
    [[RepeatedKFold]]
        n_splits = 5
        n_repeats = 2
    [[RepeatedKFold_learn]]
        n_splits = 5
        n_repeats = 2
Let’s take a look at the same full fit and RepeatedKFold random cross-validation tests for this run:
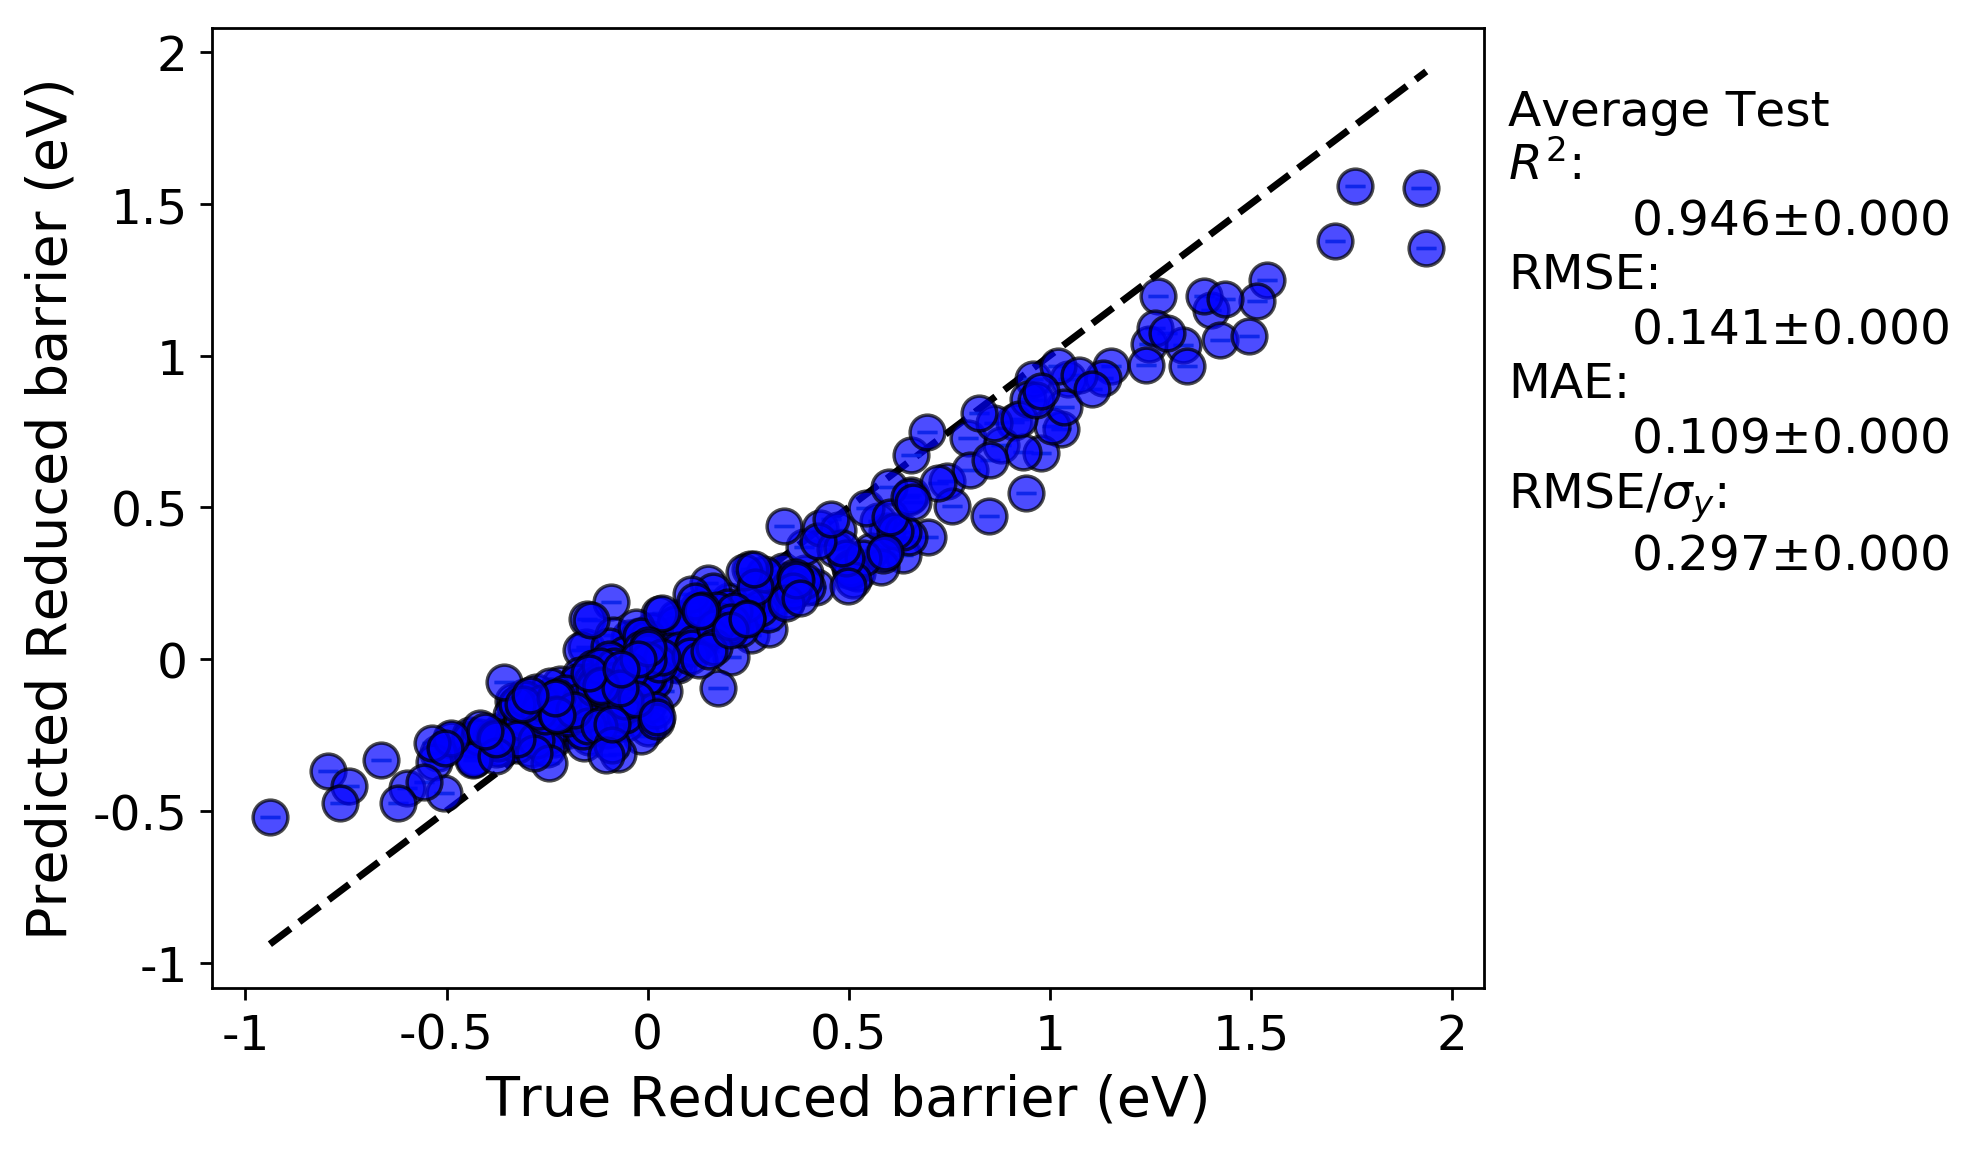
Full-fit:
Random leave out cross-validation:
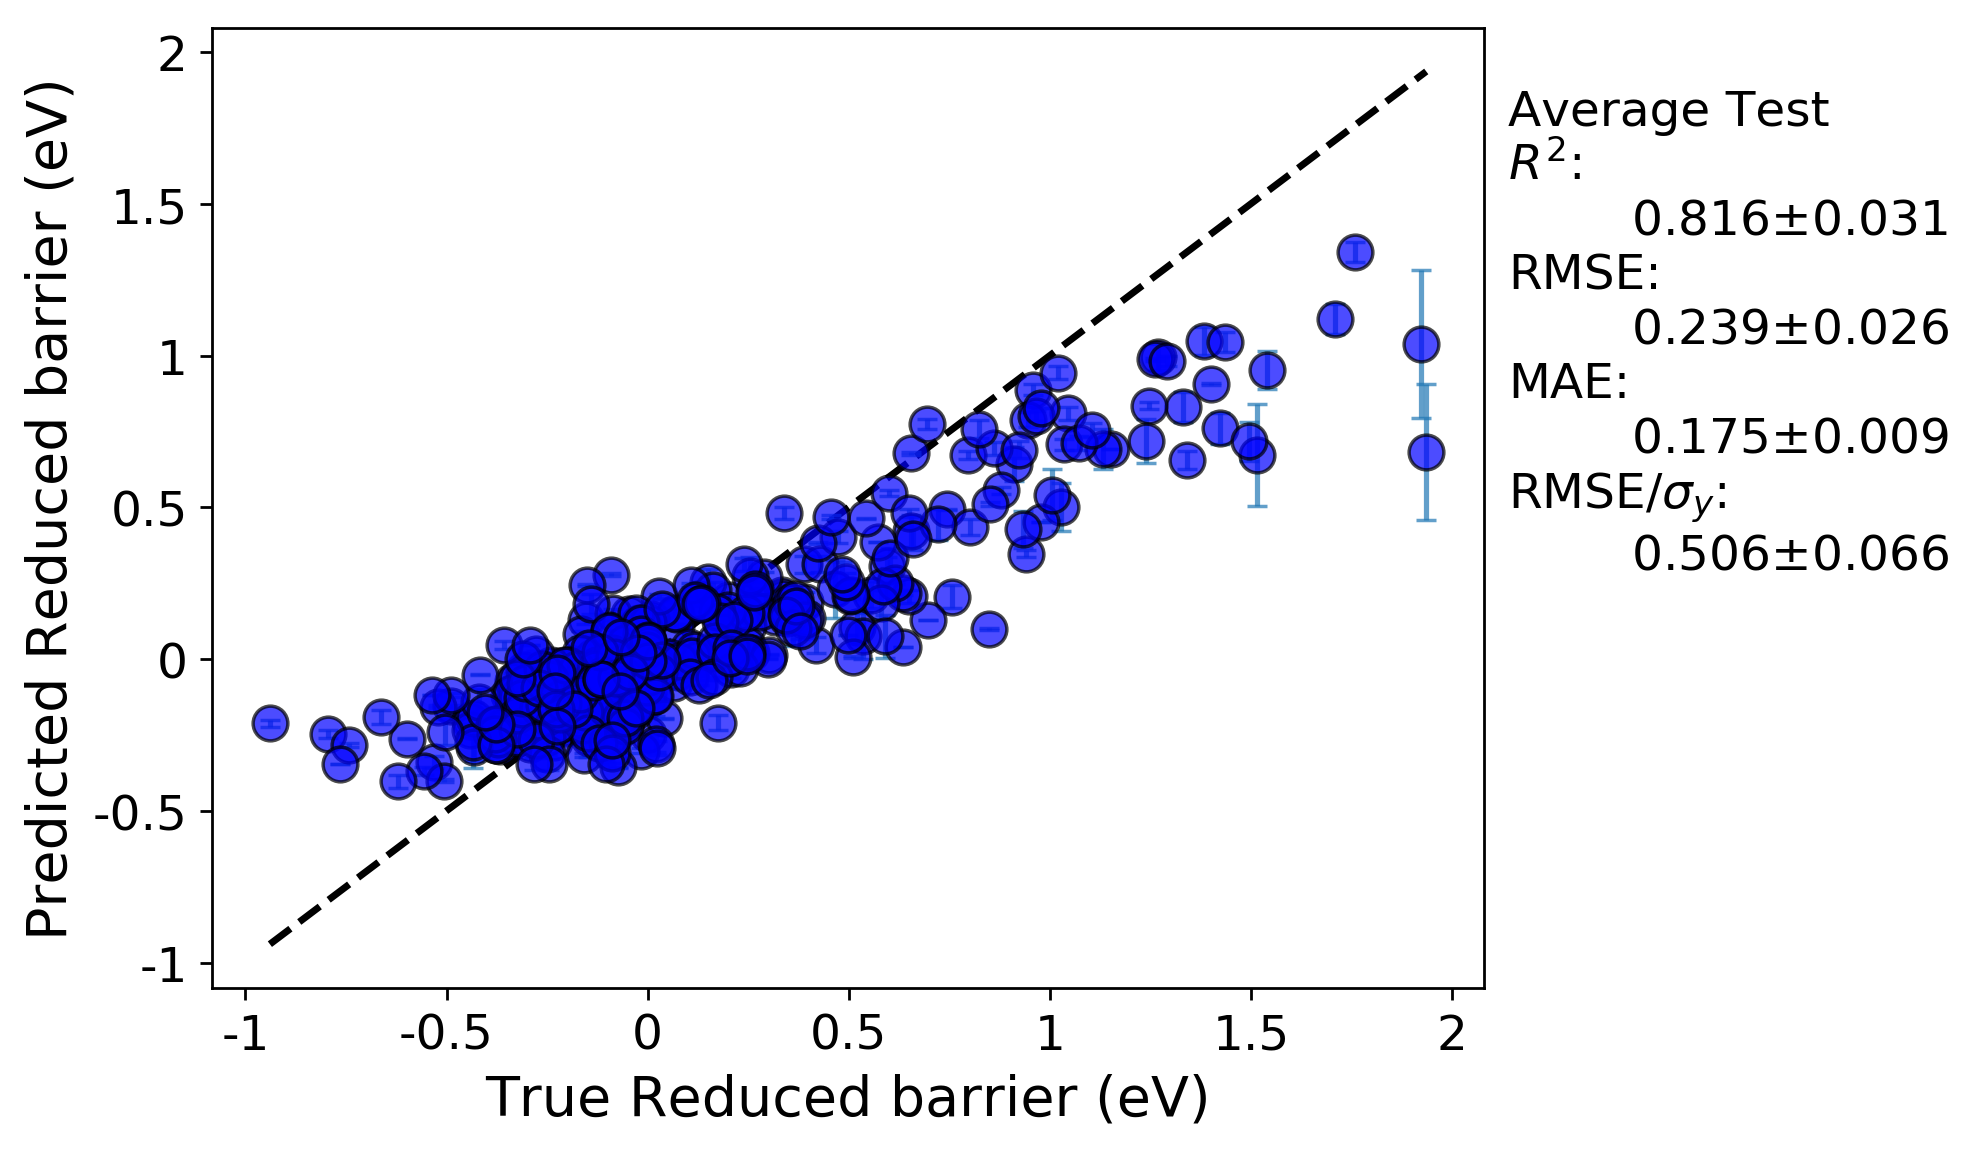
What we can see is, now that we down-selected features from more than 300 features in the previous run to just 20 here, that the fits have noticeably improved and the problem of over-fitting has been minimized. Below, we can look at the plotted learning curves
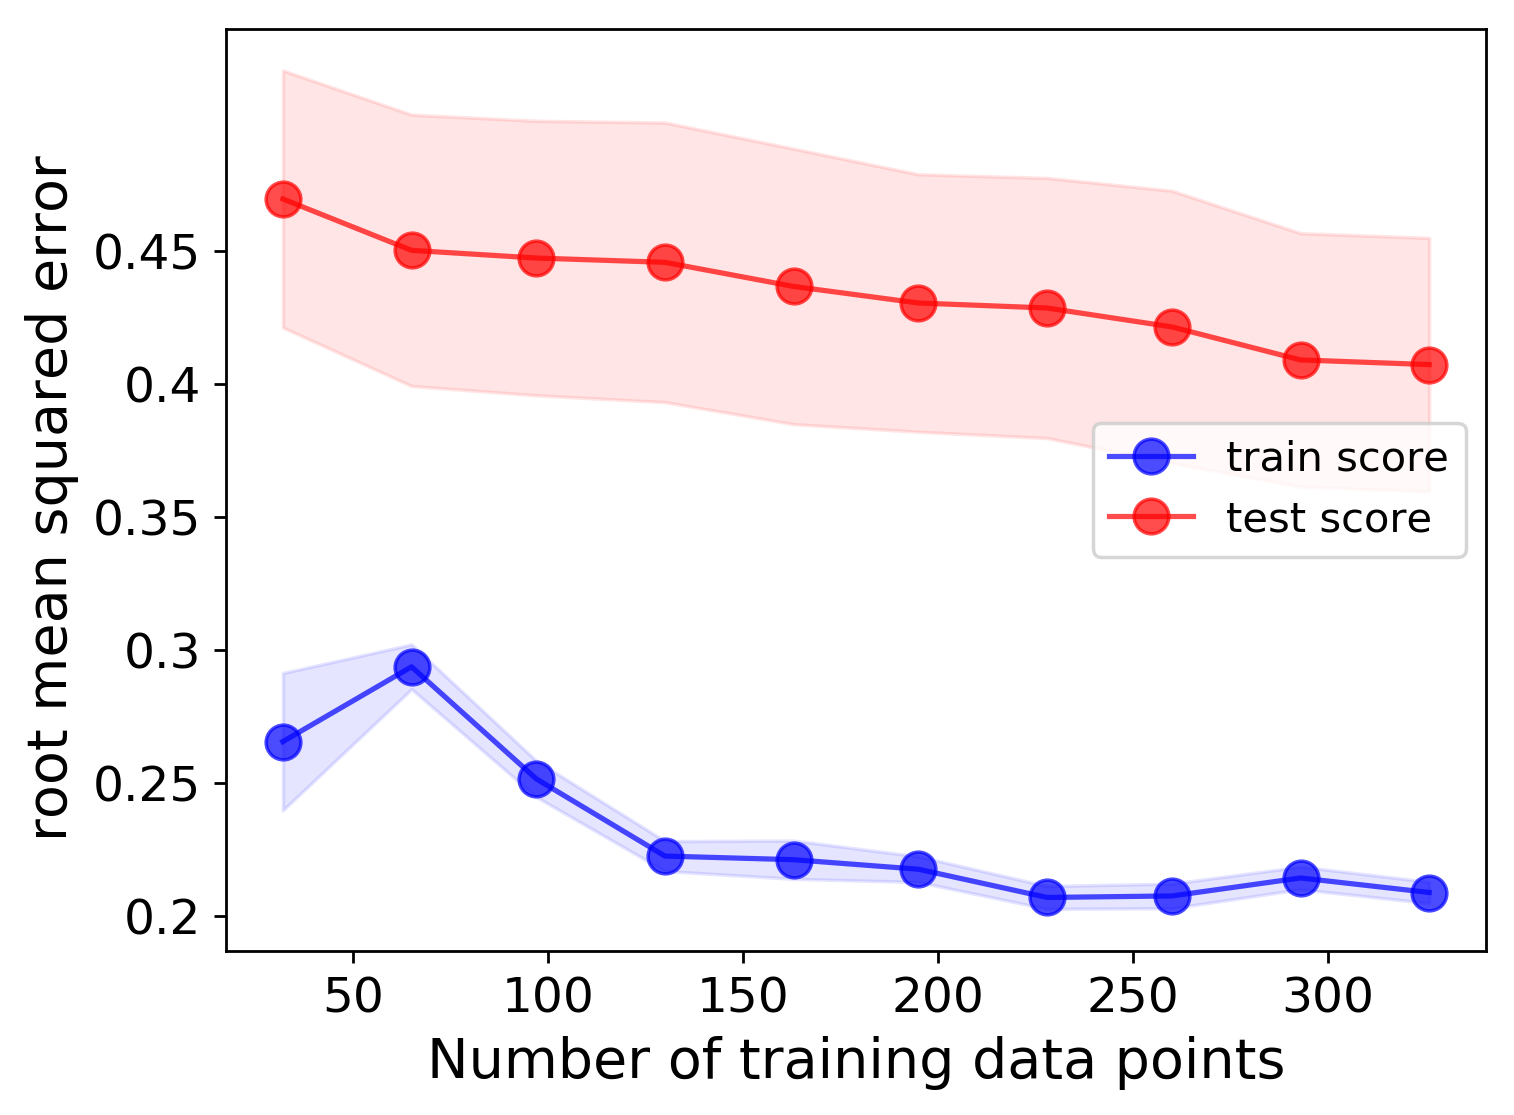
Data learning curve:
Feature learning curve:
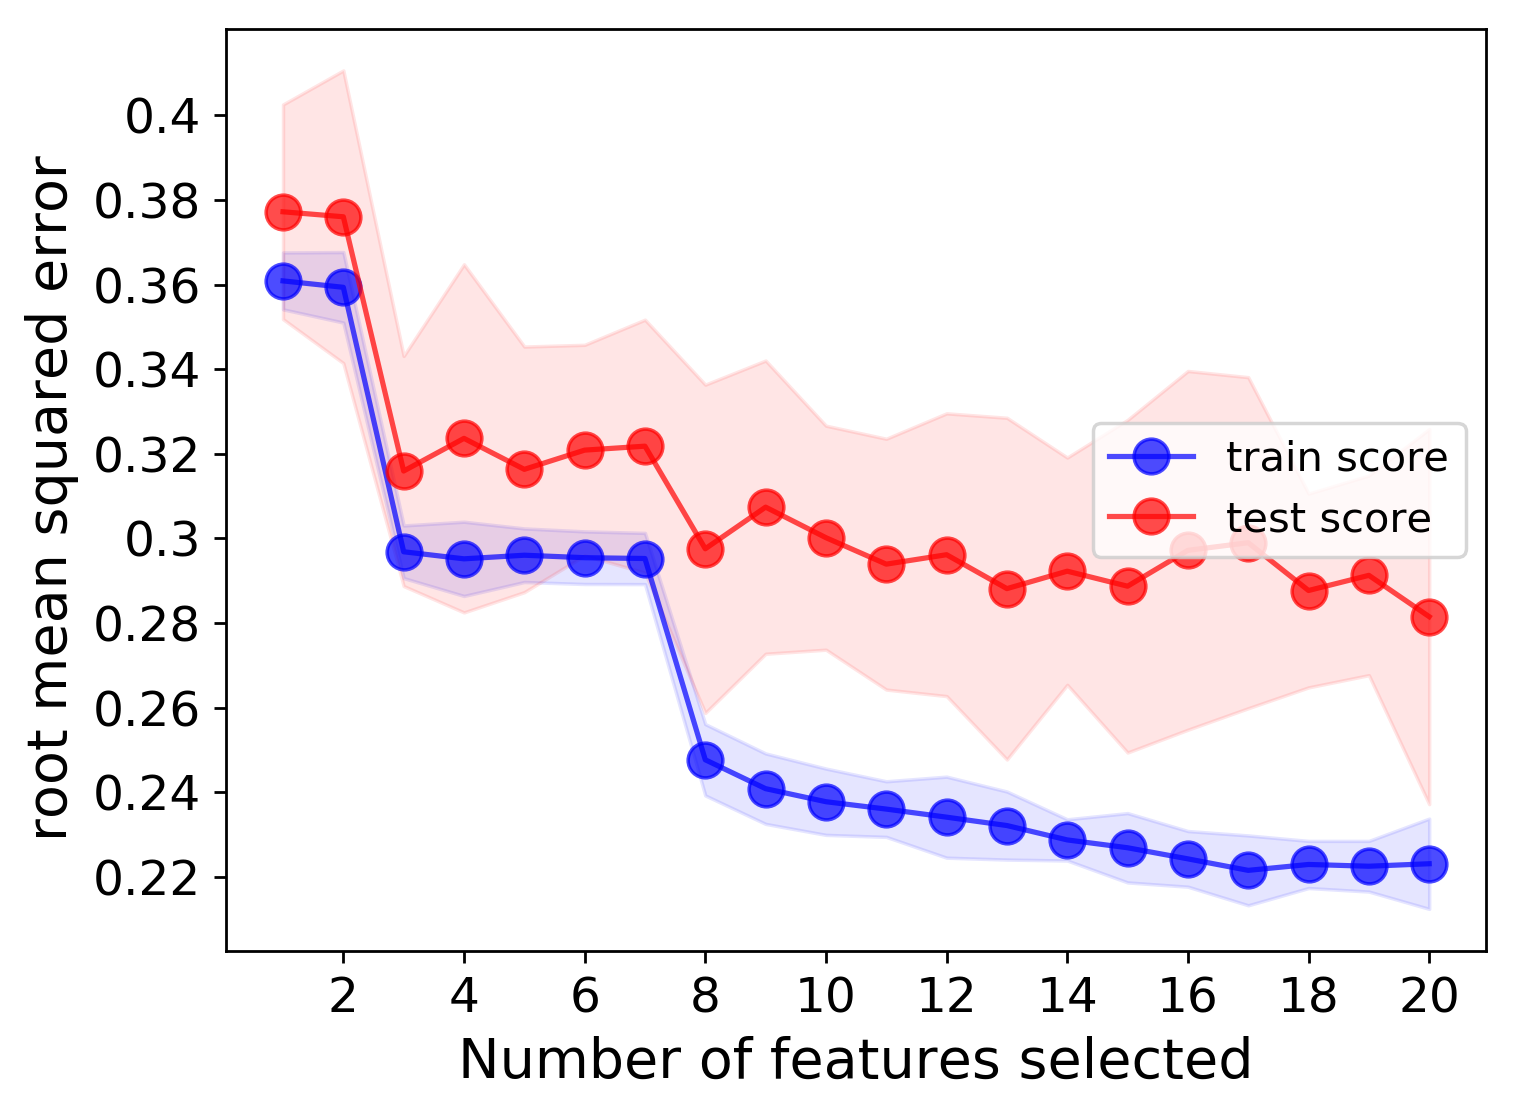
We can clearly see that, as expected, having more training data will result in better test scores, and adding more features (up to a certain point) will also result in better fits. Based on these learning curves, one may be able to argue that additional features should could be used to further lower the error.