Random leave-out versus leave-out-group cross-validation
Here, we will use our selected feature set and optimized KernelRidge hyperparameters from the previous section to do a new kind of cross-validation test: leave out group (LOG) CV. To do this, you will modify the alpha and gamma values in the Models section, KernelRidge model in your input file. In addition, you can rename the selected.csv data file to a new name, for example “example_data_selected.csv”, and use the path to this new data file for this new run, as we will not be performing feature selection again (to save time).
We will compare these results to the results of LOG cross-validation with the random cross-validation. Our input data file had a column called “Host element”. This is a natural grouping to use for this problem, as it is interesting to assess our fits when training on a set of host elements and predicted the values of an entirely new host element set, without having ever trained on that set. Modify your input file to match what is shown below. Note that we have commented out the sections that we no longer want with the # symbol. You can either comment out the sections or remove them entirely.
Example:
[GeneralSetup]
    input_features = Auto
    input_target = Reduced barrier (eV)
    randomizer = False
    metrics = Auto
    input_other = Host element, Solute element, predict_Pt
    input_grouping = Host element

#[DataCleaning]
#    cleaning_method = imputation
#    imputation_strategy = mean

#[FeatureGeneration]
#    [[Magpie]]
#        composition_feature = Solute element

[FeatureNormalization]
    [[StandardScaler]]

#[FeatureSelection]
#    [[SequentialFeatureSelector]]
#        estimator = KernelRidge_select
#        k_features = 20

#[LearningCurve]
#    estimator = KernelRidge_learn
#    cv = RepeatedKFold_learn
#    scoring = root_mean_squared_error
#    n_features_to_select = 20
#    selector_name = SelectKBest

[Models]
    [[KernelRidge]]
        kernel = rbf
        alpha = 0.034
        gamma = 0.138
    #[[KernelRidge_select]]
    #    kernel = rbf
    #    alpha = 1
    #    gamma = 1
    #[[KernelRidge_learn]]
    #    kernel = rbf
    #    alpha = 1
    #    gamma = 1

[DataSplits]
    [[NoSplit]]
    [[RepeatedKFold]]
        n_splits = 5
        n_repeats = 2
    #[[RepeatedKFold_learn]]
    #    n_splits = 5
    #    n_repeats = 2
    [[LeaveOneGroupOut]]
        grouping_column = Host element

#[HyperOpt]
#    [[GridSearch]]
#        estimator = KernelRidge
#        cv = RepeatedKFold
#        param_names = alpha ; gamma
#        param_values = -5 5 100 log ; -5 5 100 log
#        scoring = root_mean_squared_error
The main new additions to this input file is under the General Setup section, where the parameter grouping_feature needs to be added, and the addition of LeaveOutGroup to the DataSplits section.
By doing this run, we can assess the model fits resulting from the random cross-validation and the LOG cross-validation.
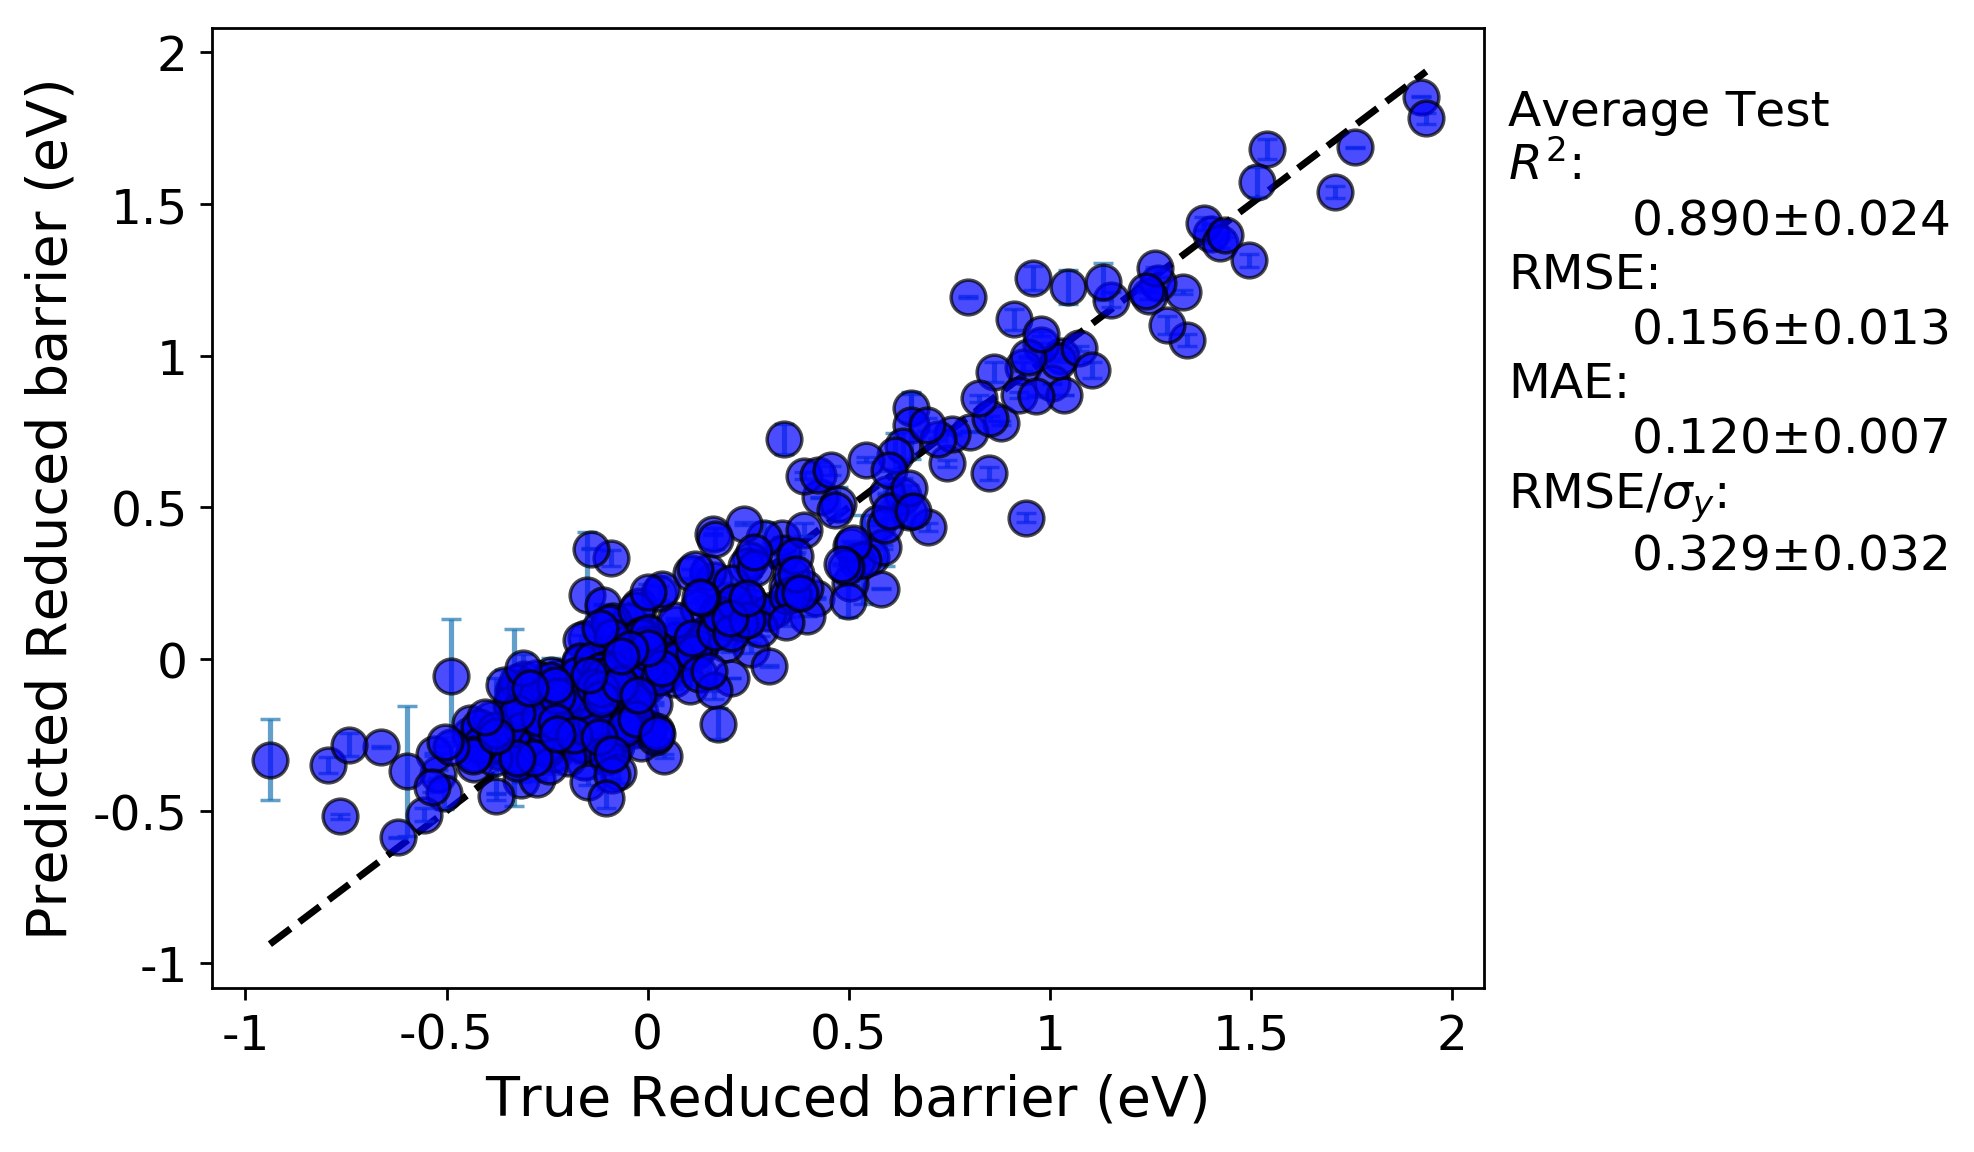
Random cross-validation:
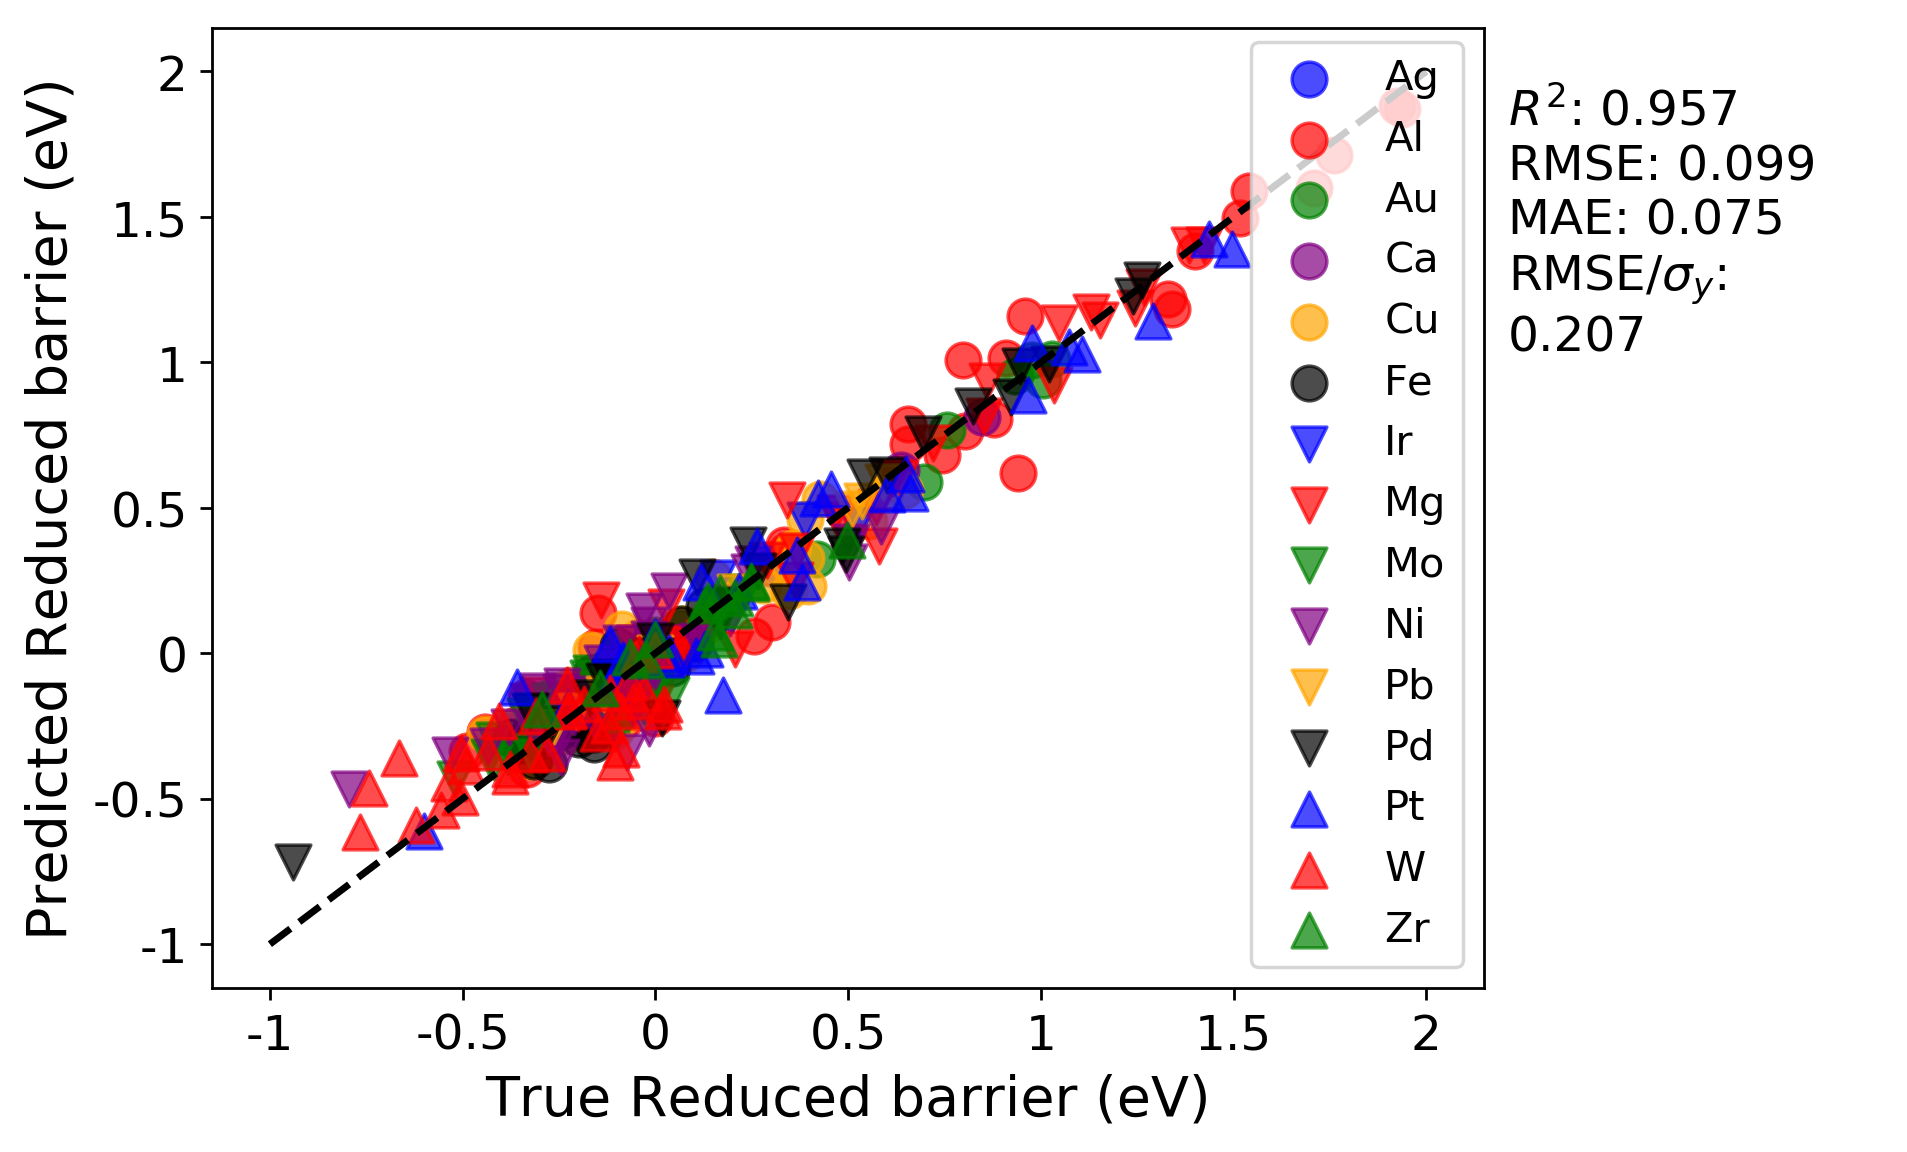
LOG cross-validation:
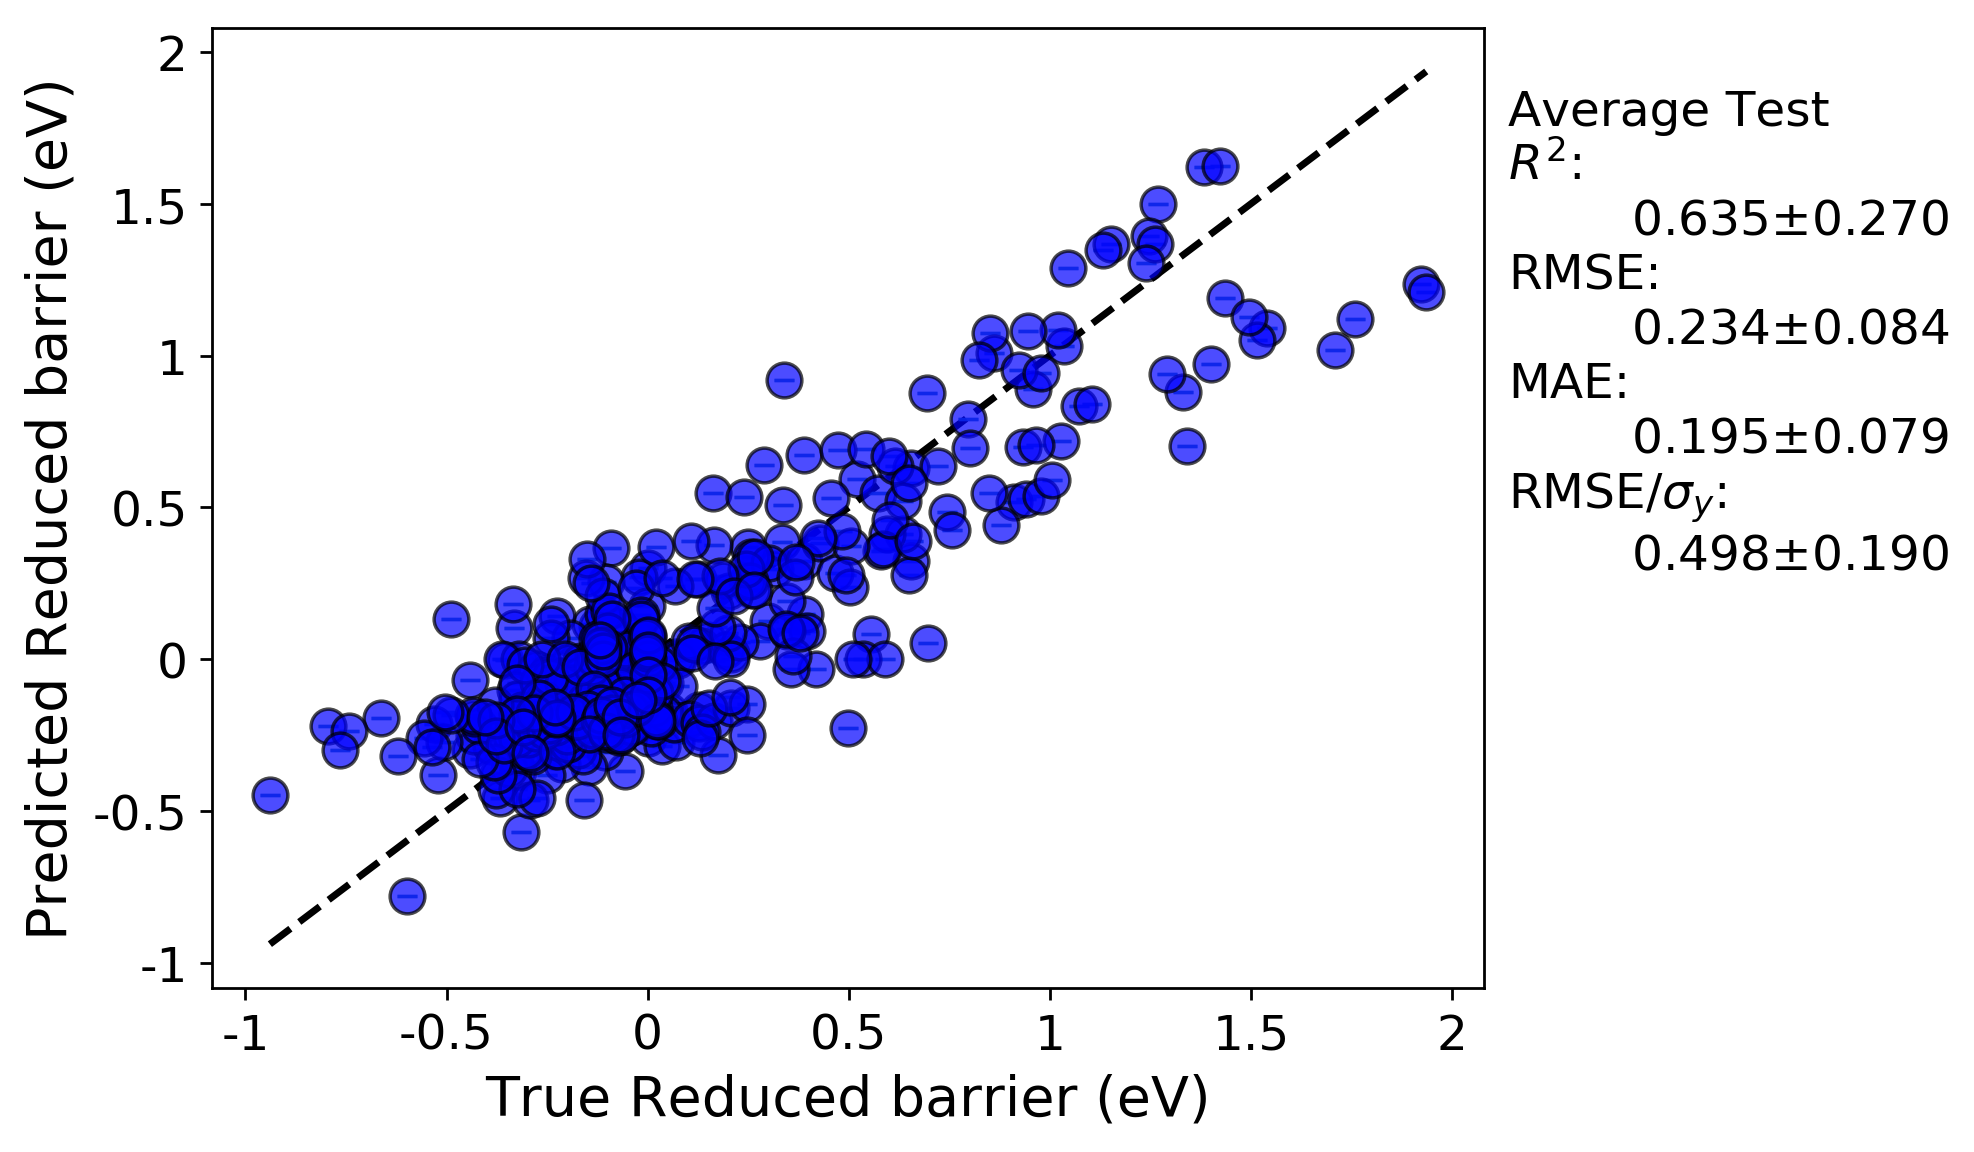
We can immediately see the R-squared and errors are both worse for the LOG cross-validation test compared to the random cross-validation test. This is likely because the LOG test is a more rigorous test of model extrapolation, because the test scores in each case are for data for which host elements were never included in the training set. In addition, a minor effect contributing to the reduced accuracy may be due to the fact that the model hyperparameters were optimized by evaluating the root mean squared error for a random cross-validation test. If instead the parameters were optimized using the LOG test, the resulting fits would likely be improved.
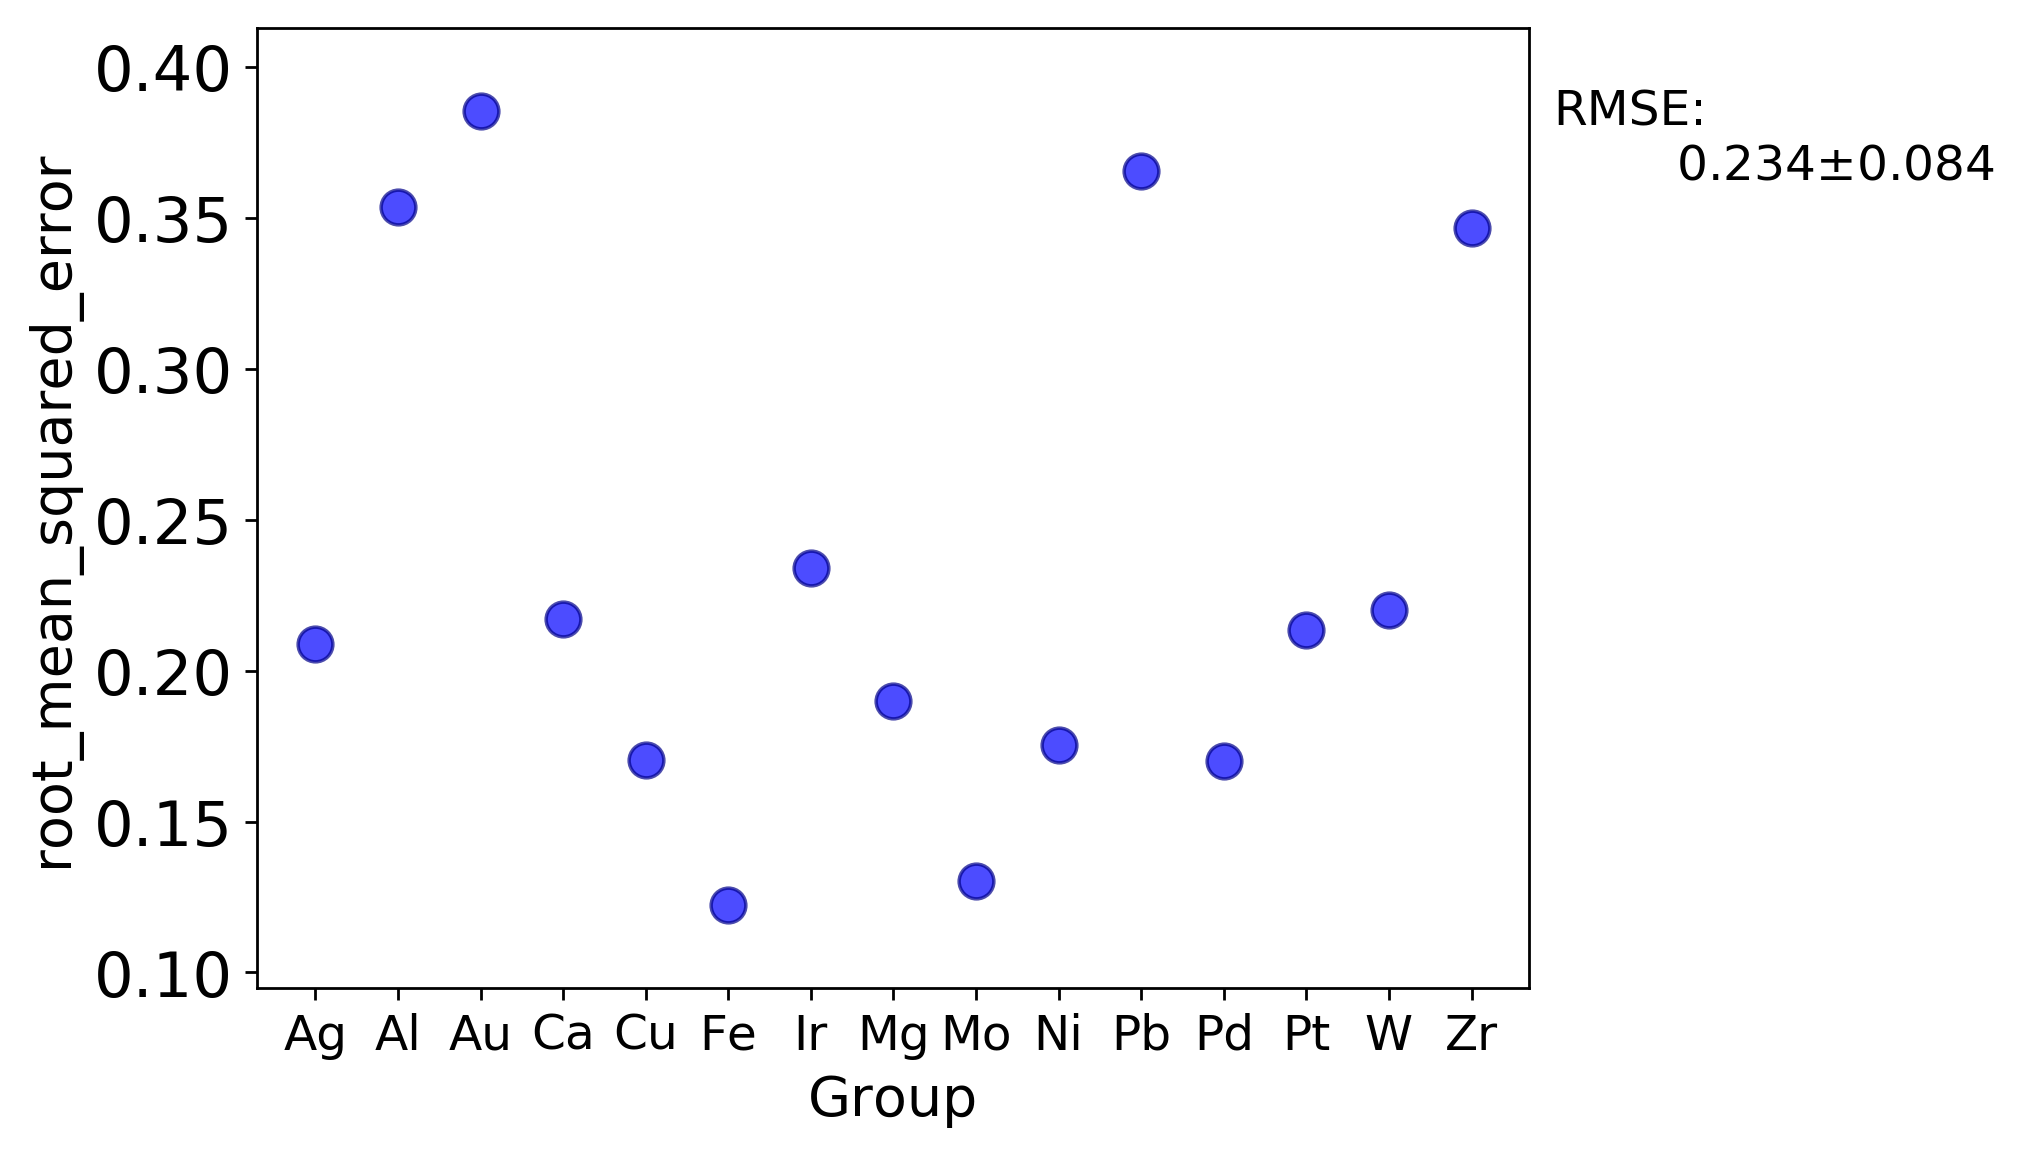
There are a couple additional plots that are usual output for a LOG test that are worth drawing attention to. The first is a plot of each metric test value for each group. This enables one to quickly assess which groups perform better or worse than others.
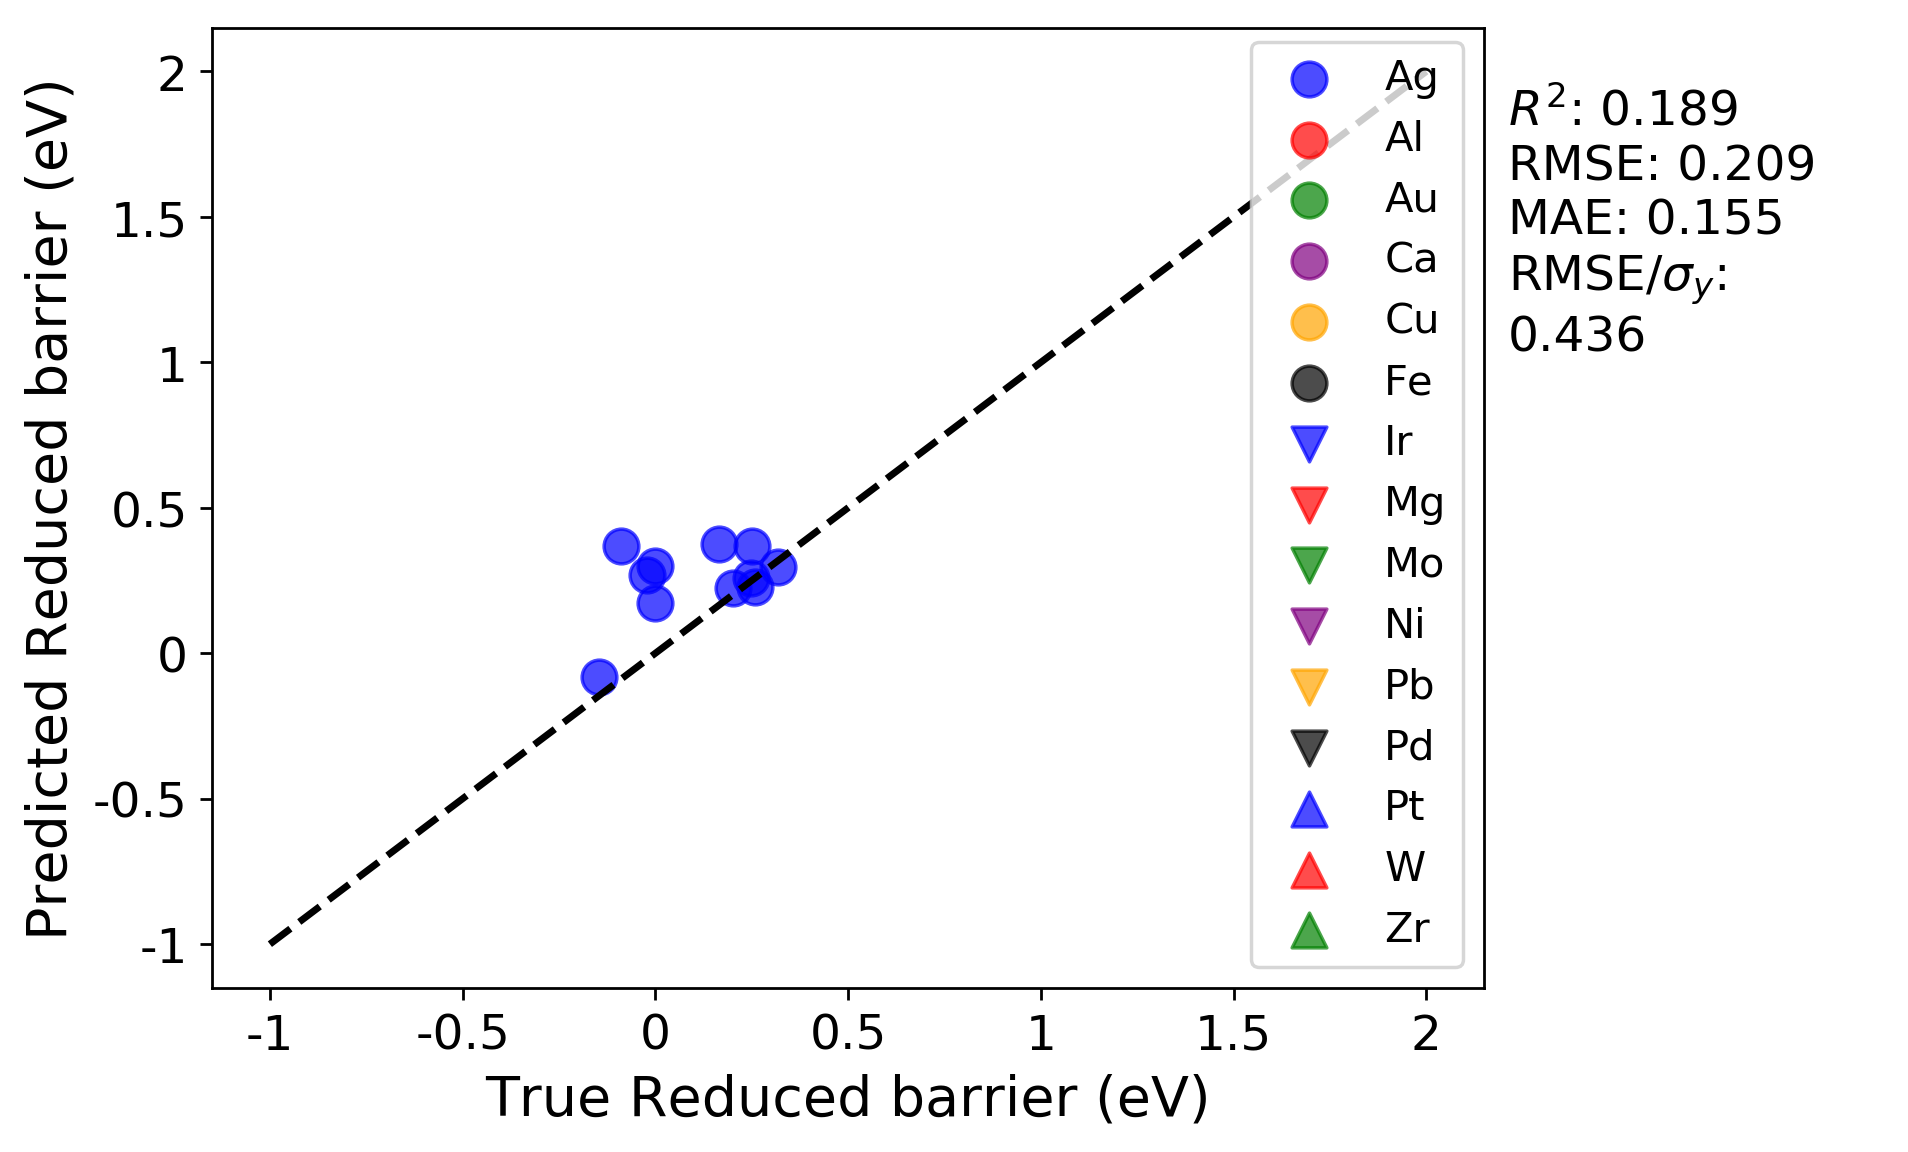
In addition, the parity plots for each split are now plotted with symbols denoting each group, which can help assess clustering of groups and goodness of fit on a per-group basis.
Training on all groups except Ag:
Testing on just Ag as the left-out host element: